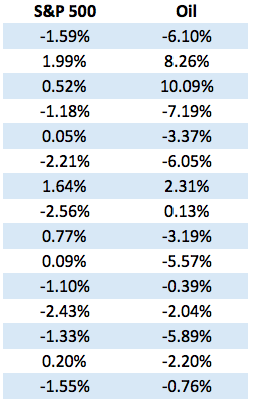
Oil and the stock market have a relationship that looks simple on a chart and turns delightfully messy the moment you ask, “So what does it actually mean?” One month, rising oil prices seem to drag stocks lower because investors worry about inflation, consumer spending, and corporate margins. Another month, oil and stocks rise together because both are reacting to the same thing: a growing economy with stronger demand. Then, just when everyone thinks they have cracked the code, oil falls, stocks fall too, and the market quietly laughs into its coffee.
That is the heart of the oil and stock market correlation debate. Crude oil is not just another commodity. It is an input cost, an inflation signal, a geopolitical risk barometer, a transportation expense, a corporate earnings variable, and occasionally the financial market’s favorite drama queen. The stock market, meanwhile, is not one single creature. The S&P 500 includes energy producers, airlines, retailers, banks, technology giants, manufacturers, and consumer brands. Higher oil prices do not hit all of them the same way. For Exxon Mobil, oil strength may be good news. For an airline, it can feel like the bill at the end of an expensive dinner where nobody remembers ordering lobster.
So, about that oil and stock market correlation: yes, it exists. No, it is not stable. And absolutely, it should not be treated like a magic trading signal wearing a tiny wizard hat.
What Does “Oil and Stock Market Correlation” Actually Mean?
Correlation measures how two assets move in relation to each other. If oil prices and stocks often rise or fall together, they have a positive correlation. If oil rises while stocks fall, they have a negative correlation. If they wander around like two tourists who lost each other at an airport, the correlation is weak or inconsistent.
In practice, the relationship between crude oil prices and stock market performance changes depending on the economic backdrop. A simple chart comparing West Texas Intermediate crude oil, Brent crude oil, and the S&P 500 can show periods of strong connection and periods of near-total disagreement. That is because oil can represent different things at different times.
Oil can be a growth signal
When the global economy is expanding, businesses ship more goods, consumers travel more, factories consume more energy, and demand for petroleum products rises. In that environment, higher oil prices can reflect stronger economic activity. Stocks may rise at the same time because investors expect better earnings. In other words, oil and equities can move together because both are responding to improving demand.
Oil can be an inflation signal
When oil rises because supply is disrupted, the story changes. Higher crude prices can feed into gasoline, diesel, jet fuel, shipping costs, petrochemicals, and broader inflation expectations. Investors then worry that central banks may keep interest rates higher for longer, consumer spending may weaken, and profit margins may get squeezed. In that environment, oil and stocks can move in opposite directions.
Oil can be a risk signal
Oil often reacts quickly to geopolitical stress. Conflicts, sanctions, shipping disruptions, OPEC+ decisions, refinery outages, and unexpected inventory changes can all move crude prices. Sometimes stocks look past the event. Sometimes they panic first and read the details later, which is very “market of them.”
Why the Correlation Changes Over Time
The biggest mistake investors make is assuming oil has one fixed relationship with stocks. It does not. The oil-stock correlation is regime-dependent, meaning it changes with the economic environment, inflation cycle, interest-rate outlook, and the source of the oil price move.
Academic research on oil shocks often separates oil price changes into categories. A demand-driven oil shock is different from a supply-driven oil shock. If oil rises because global demand is strong, stocks may take it as a sign of economic health. If oil rises because supply is suddenly restricted, stocks may interpret it as a cost shock. Same oil chart, very different market meaning.
This explains why “oil is up, stocks must go down” is too simplistic. Sometimes oil is up because the economy is humming. Sometimes oil is up because investors fear shortages. Sometimes oil is up because traders are positioning around inventories, currencies, futures curves, or headlines. The stock market cares not only about the price move but also about the reason behind the move.
The Main Channels Connecting Oil and Stocks
1. Inflation and interest rates
Oil is closely watched because energy prices affect headline inflation. Gasoline prices are visible to consumers in a way that, say, industrial resin prices are not. Nobody drives past a giant sign announcing the price of polypropylene on their way to school. But gasoline? Everyone sees it.
When energy prices rise sharply, households may expect inflation to remain high. Bond markets may price in tighter monetary policy. If investors believe the Federal Reserve will keep rates elevated, equity valuations can come under pressure, especially for growth stocks whose expected profits are far in the future. Higher discount rates make those future profits less valuable today.
2. Consumer spending
Higher oil prices usually mean higher gasoline and transportation costs. For consumers, that can reduce discretionary spending. Money spent filling the tank is money not spent on restaurants, apparel, electronics, vacations, or that suspiciously expensive iced coffee that somehow became a lifestyle.
This matters for consumer discretionary stocks. Retailers, travel companies, restaurants, and leisure businesses may face pressure when energy costs rise too quickly. However, if wages are strong and the economy is healthy, consumers may absorb higher fuel prices better than expected. Again, context does the heavy lifting.
3. Corporate margins
Oil affects companies through input costs. Airlines need jet fuel. Delivery companies need diesel. Chemical companies use petroleum-based feedstocks. Manufacturers and retailers face transportation costs. When oil prices rise, companies either absorb the cost, pass it to customers, or do a little of both.
If businesses have pricing power, margins may hold up. If customers resist price increases, profits can shrink. That is why oil shocks often show up differently across sectors. A broad stock index can hide enormous variation beneath the surface.
4. Energy sector earnings
For energy producers, oil prices directly influence revenue and cash flow. When crude prices rise, exploration and production companies may benefit. Integrated oil majors, oilfield service firms, pipeline companies, and refiners can also be affected, though not always in the same way.
This creates an interesting index-level effect. If energy stocks are a small share of the S&P 500, rising oil may not lift the whole index much. But if energy leadership is strong while other sectors are weak, the market can look divided: energy celebrating upstairs, consumer stocks nervously checking the bill downstairs.
5. The U.S. dollar
Oil is generally priced in U.S. dollars. A stronger dollar can pressure commodity prices by making oil more expensive for buyers using other currencies. At the same time, global risk sentiment, interest-rate expectations, and currency moves can affect both oil and stocks. Sometimes oil and equities appear correlated because both are reacting to the dollar or global liquidity conditions.
Historical Examples: When Oil and Stocks Told Different Stories
The 1970s oil shocks
The 1970s remain the classic example of supply-driven oil shocks hurting the economy. Oil price spikes contributed to inflation, weaker growth, and market stress. For investors, the lesson was clear: when oil rises because supply is constrained and inflation expectations become unanchored, equities may struggle.
The 2008 oil spike and financial crisis
In the first half of 2008, oil surged as global demand remained strong and commodity markets attracted heavy attention. Later, as the financial crisis intensified, both oil and stocks collapsed. This period is a reminder that correlation can flip quickly. Early oil strength reflected demand and speculation; later oil weakness reflected a dramatic collapse in global growth expectations.
The 2014–2016 oil crash
From 2014 into early 2016, oil prices fell sharply as supply growth, especially from U.S. shale, collided with slower demand growth and OPEC strategy shifts. Lower oil prices helped consumers, but they hurt energy companies, high-yield credit tied to energy producers, and oil-dependent regions. Stocks had mixed reactions because cheap oil was both a consumer benefit and a signal of stress in the energy sector.
The 2020 pandemic shock
During the early pandemic, oil demand collapsed as travel, commuting, and industrial activity slowed dramatically. Stocks also plunged as investors priced in recession risk. In that case, oil and stocks fell together because both were reacting to the same demand shock. The oil market had its own special chaos, including extreme futures-market dislocations, but the broad message was simple: demand vanished, and markets noticed.
The 2022 inflation cycle
In 2022, energy prices rose alongside broader inflation pressures, supply-chain problems, and geopolitical disruption after Russia’s invasion of Ukraine. Stocks came under pressure as interest rates rose and investors worried about persistent inflation. This was a period when oil strength often felt like bad news for equities because it reinforced the higher-rates narrative.
Why Sector Matters More Than the Headline Index
Talking about “the stock market” can be misleading. The S&P 500 is a collection of sectors with different oil sensitivities. Energy stocks may prefer higher crude prices. Airlines, trucking firms, and some retailers may prefer lower fuel costs. Banks may care more about interest rates and credit risk. Technology firms may respond more to discount rates, earnings growth, and investor appetite for risk.
For example, if oil rises from $70 to $90 per barrel because global growth is improving, energy stocks may rally, industrials may hold up, and consumer stocks may remain stable if employment is strong. But if oil jumps from $70 to $90 because a major shipping route is threatened, investors may worry about inflation, margins, and central-bank policy. The same price level can produce a different equity reaction because the story behind the move changed.
Oil Prices, Earnings, and Valuation Multiples
Stock prices are driven by expected earnings and the valuation investors are willing to pay for those earnings. Oil can influence both.
On the earnings side, higher oil prices can boost profits for energy producers while hurting companies with heavy fuel exposure. On the valuation side, oil-driven inflation can push bond yields higher. Higher yields often compress valuation multiples, especially for expensive growth stocks. This is why oil can affect the stock market even when a company does not directly use much oil. The connection may travel through inflation expectations, interest rates, and investor sentiment.
That indirect channel is important. A software company may not care much about diesel prices in its daily operations. But if higher oil contributes to higher inflation expectations and higher Treasury yields, that software company’s valuation can still feel the pressure. Markets are connected in ways that make spreadsheets look like conspiracy boards with string and thumbtacks.
Does Oil Predict the Stock Market?
Oil can provide useful information, but it is not a reliable stand-alone stock market predictor. A rising oil price may signal strong demand, inflation risk, supply disruption, geopolitical tension, or financial speculation. A falling oil price may signal oversupply, weaker demand, improved supply conditions, or recession fears. Without context, the oil price alone is just a number with a very expensive public-relations department.
Investors should avoid treating oil as a one-step forecast for equities. A better approach is to ask a sequence of questions:
- Is oil rising because of demand, supply disruption, or financial positioning?
- Are inflation expectations rising with oil?
- Are bond yields moving higher or lower?
- Which sectors benefit and which sectors suffer?
- Is the move temporary, or does the market believe it will last?
- Are consumers and companies able to absorb the price change?
Those questions turn oil from a noisy headline into a useful macro signal.
What Investors Should Watch
Crude oil benchmarks
Brent crude is the global benchmark, while West Texas Intermediate is the key U.S. benchmark. Both matter, but they can diverge due to storage, transportation, refining, and regional supply factors.
Inventories
Oil inventories help reveal whether the market is oversupplied or undersupplied. Rising inventories often pressure prices, while falling inventories can support prices. However, inventory location matters. Barrels stored in one region may not be easily available where they are needed.
Futures curves
The oil futures curve can show whether the market is in contango or backwardation. Contango often suggests comfortable supply or weak near-term demand, while backwardation can signal tight immediate supply. These signals are not perfect, but they add valuable context.
Inflation expectations
Oil becomes more dangerous for equities when it lifts inflation expectations and bond yields. If investors believe central banks must respond to higher energy prices with tighter policy, stocks may face pressure.
Sector rotation
Watch whether energy stocks are leading, whether transports are lagging, and whether consumer discretionary shares are weakening. Sector behavior can reveal how investors interpret the oil move.
Common Myths About Oil and the Stock Market
Myth 1: High oil is always bad for stocks
Not always. If higher oil reflects strong global growth, equities may rise too. The problem is not high oil by itself; the problem is high oil caused by a damaging supply shock or inflation scare.
Myth 2: Low oil is always good for stocks
Cheap oil can help consumers and fuel-intensive businesses. But if oil is falling because demand is collapsing, stocks may fall as well. A discount is not always a gift. Sometimes it is a warning label.
Myth 3: Energy stocks represent the whole oil effect
Energy stocks are only one channel. Oil also affects inflation, rates, margins, currencies, consumer confidence, and credit conditions. The market reaction can be much broader than the energy sector.
Myth 4: Correlation equals causation
Oil and stocks may move together because both are responding to another force, such as global growth, monetary policy expectations, or geopolitical risk. Correlation is a clue, not a confession.
Experiences and Practical Observations About Oil & Stock Market Correlation
In real-world market watching, the oil-stock relationship is most useful when treated like a conversation rather than a command. The mistake many beginners make is seeing crude oil move sharply and immediately assuming the stock market must respond in a fixed direction. But markets rarely behave like vending machines. You cannot insert “oil up” and automatically receive “stocks down.” Sometimes the machine gives you energy-sector outperformance, sometimes a bond-yield tantrum, and sometimes a bag of confusion with no receipt.
One practical experience from observing market cycles is that the first reaction is not always the final reaction. When oil jumps on a geopolitical headline, stock futures may initially drop because traders fear supply disruption and inflation. A few hours later, if the disruption appears temporary or inventories look comfortable, equities may recover. The reverse can also happen. Stocks may ignore higher oil for days, only to sell off later when bond yields rise or analysts begin cutting margin forecasts for transportation, retail, and industrial companies.
Another useful lesson is to watch the bond market. Oil by itself can be noisy, but oil plus rising Treasury yields often sends a clearer message. If crude prices rise and yields climb because investors expect inflation to stay hotter, growth stocks may struggle. If oil rises but yields remain calm, the equity market may decide the move is manageable. This is why experienced investors often look at oil, inflation expectations, and rates together instead of staring at a crude chart like it contains the meaning of life.
Sector behavior also tells a story. During oil rallies, energy stocks may outperform, but that does not automatically mean the overall market is healthy. If energy is rising while airlines, retailers, small caps, and consumer discretionary names are weakening, the market may be pricing in a cost shock. If energy, industrials, financials, and consumer stocks all rise together, the oil move may be connected to stronger economic demand. The difference matters.
For businesses, the experience is even more direct. A delivery company, airline, farm operator, manufacturer, or restaurant chain does not discuss oil as an abstract macro variable. Fuel and transportation costs affect budgets, pricing decisions, and profit margins. When oil rises quickly, managers may delay hiring, raise prices, adjust routes, hedge fuel costs, or renegotiate supplier contracts. Those decisions eventually flow into earnings reports, guidance, and stock prices.
For everyday consumers, oil’s impact is visible at the gas pump. Higher gasoline prices can change behavior quickly. Families may postpone road trips, reduce discretionary spending, or become more cautious. The stock market watches this because consumer spending is a major part of the U.S. economy. When fuel costs bite, investors ask whether households will keep spending or start protecting their wallets like a dragon sitting on gold.
The most valuable experience-based takeaway is simple: oil is a signal, not a script. It helps investors understand inflation pressure, demand strength, sector rotation, and risk sentiment. But it must be read alongside inventories, rates, the dollar, earnings, and consumer behavior. Anyone claiming oil perfectly predicts stocks is probably selling confidence by the barrel.
Conclusion: The Correlation Is Real, but the Story Matters More
The relationship between oil prices and the stock market is real, but it is not mechanical. Oil can be bullish for stocks when it reflects strong demand. It can be bearish when it reflects inflation, supply disruption, or geopolitical risk. It can help energy companies while hurting fuel-intensive sectors. It can influence consumer spending, corporate margins, bond yields, and Federal Reserve expectations.
The smartest way to understand oil and stock market correlation is to stop asking, “Did oil go up or down?” and start asking, “Why did oil move, and what does that mean for earnings, inflation, rates, and risk appetite?” That question will not make the market easy, but it will make it less mysterious. And in finance, “less mysterious” is already a pretty good day.
Editorial note: This article is based on synthesized information from reputable economic, energy, and financial sources, including U.S. energy data, Federal Reserve research, market analysis, and academic studies on oil shocks and equity performance. Key supporting references include EIA oil market reporting, FRED/St. Louis Fed inflation analysis, Cleveland Fed research on oil and inflation, New York Fed commentary on inflation expectations, CME Group market education, IMF research, and peer-reviewed studies on oil shocks and stock returns.