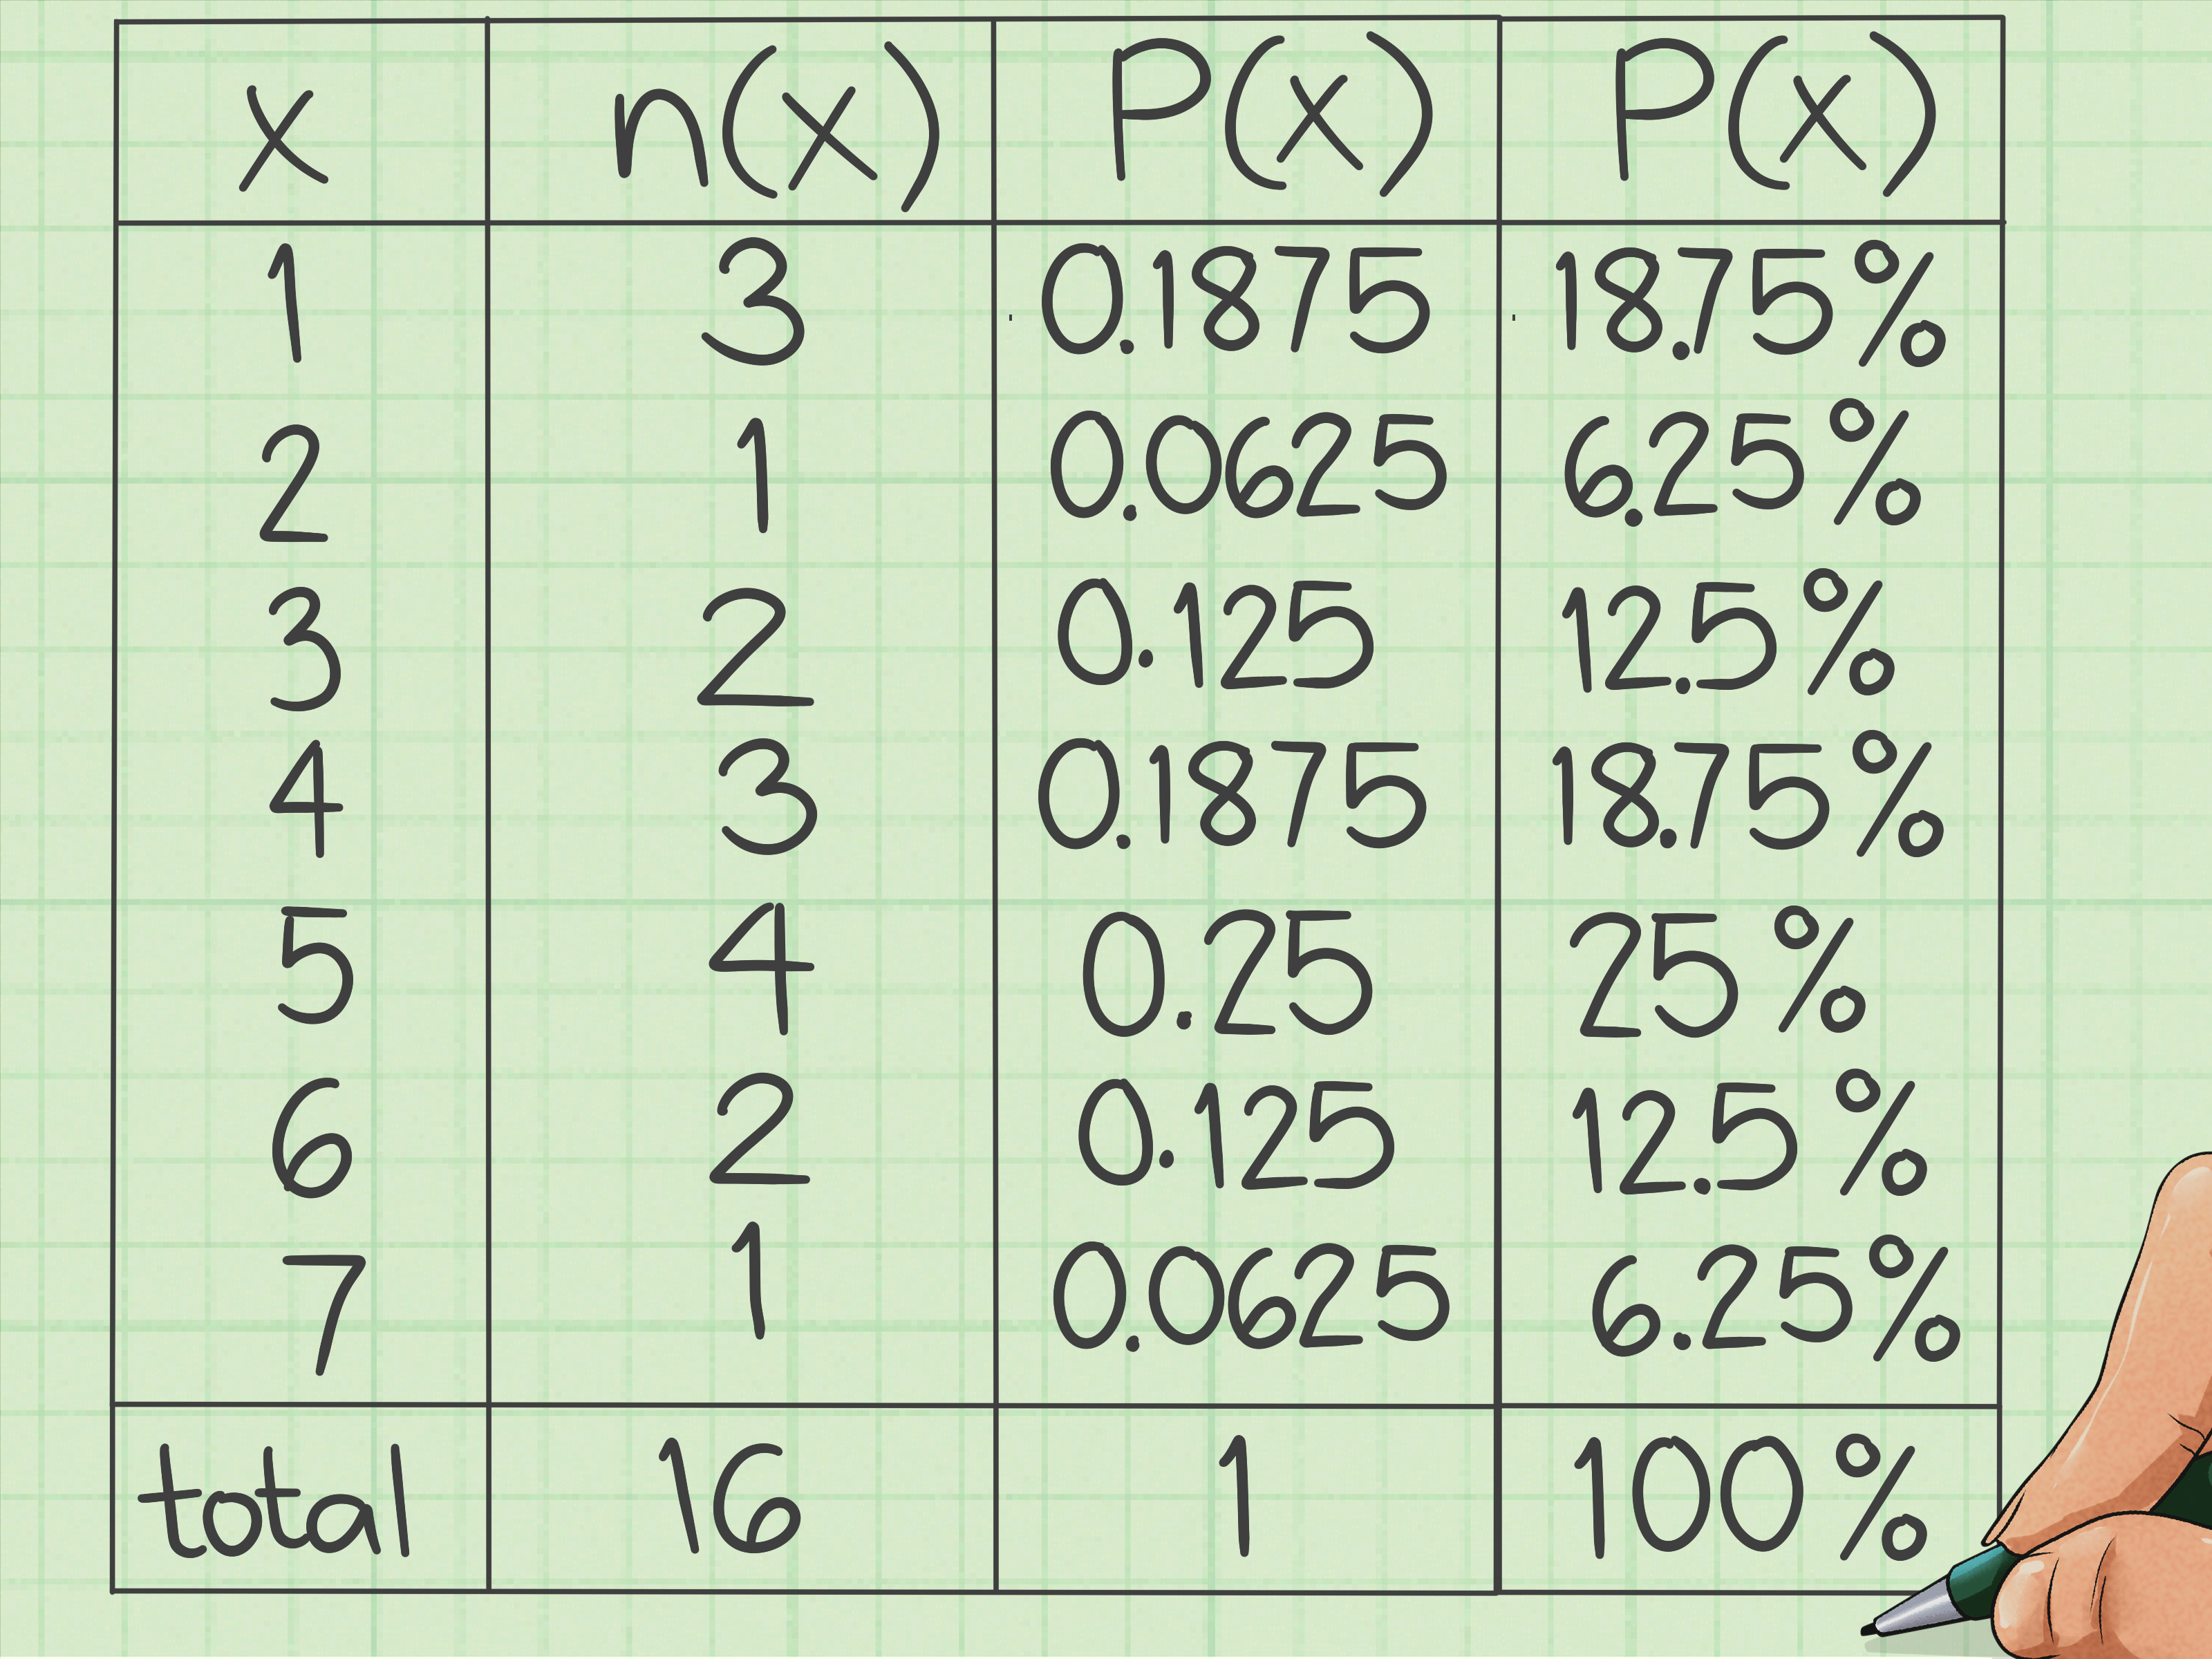
Relative frequency is one of those math ideas that sounds more intimidating than it really is. The phrase may arrive wearing a tiny statistics lab coat, but underneath, it simply answers one friendly question: “How often did this happen compared with everything that happened?”
Whether you are analyzing survey answers, classroom test scores, website clicks, favorite pizza toppings, or how many times your cat knocks a pen off the desk for scientific reasons, relative frequency helps turn raw counts into meaningful proportions. Instead of saying “12 people chose vanilla,” you can say “40% of the group chose vanilla.” Suddenly, your data has context. That is the magic trick.
In this guide, you will learn how to calculate relative frequency in 9 clear steps, with examples, tables, formulas, common mistakes, and real-world experience notes to help the concept stick. No statistical fog machine required.
What Is Relative Frequency?
Relative frequency is the fraction, decimal, or percentage that shows how often a value or category appears compared with the total number of observations. In simpler language, it tells you the share of the whole.
The basic relative frequency formula is:
Relative Frequency = Frequency of a Category ÷ Total Number of Observations
For example, if 8 students in a class of 40 prefer basketball, the relative frequency of students who prefer basketball is:
8 ÷ 40 = 0.20 = 20%
That means basketball fans make up 20% of the class. The raw count is 8, but the relative frequency is 20%. One gives you the number; the other gives you the meaning behind the number.
Why Relative Frequency Matters
Relative frequency matters because raw numbers can be misleading when the total size changes. Imagine two classrooms. In Class A, 10 students like chocolate ice cream. In Class B, 20 students like chocolate ice cream. At first, Class B sounds more chocolate-obsessed. But what if Class A has only 20 students and Class B has 100?
In Class A, 10 out of 20 students like chocolate, so the relative frequency is 50%. In Class B, 20 out of 100 students like chocolate, so the relative frequency is 20%. Now the story changes completely. Class A is the true chocolate kingdom.
This is why relative frequency is useful in statistics, probability, surveys, experiments, business reports, classroom assignments, and everyday comparisons. It lets you compare groups fairly, even when the groups are different sizes.
How to Calculate Relative Frequency: 9 Steps
Step 1: Understand the Question You Are Trying to Answer
Before touching a calculator, identify what you want to measure. Are you trying to find the relative frequency of a survey answer? A test score? A color? A product sold? A website visitor action?
A strong question might be: “What percentage of students chose math as their favorite subject?” A weaker question would be: “What about students and subjects and numbers?” Statistics likes clarity. It does not enjoy being handed a mystery smoothie.
Your goal is to define the category or event you care about. Once you know what you are counting, the rest becomes much easier.
Step 2: Collect or List Your Data
Next, gather the data. Data can come from a survey, experiment, observation, spreadsheet, quiz, poll, or frequency table. The key is that every item should belong to a clear category or value.
Suppose you ask 30 students about their favorite school subject. The answers are:
- Math: 9 students
- Science: 6 students
- English: 5 students
- History: 4 students
- Art: 6 students
These counts are called frequencies. A frequency is simply how many times something occurs. If “Math” appears 9 times, its frequency is 9.
Step 3: Find the Total Number of Observations
The total number of observations is the denominator in your calculation. It is the number you divide by. To find it, add all the frequencies together.
Using the subject example:
9 + 6 + 5 + 4 + 6 = 30
So the total number of observations is 30. This total matters because every relative frequency compares one category to the entire data set.
Always double-check the total. A wrong total is like using the wrong measuring cup in a recipe. You might still make something, but nobody should be forced to eat it.
Step 4: Choose the Category You Want to Calculate
Now pick the specific category or value you want to analyze. For example, if you want the relative frequency of students who chose Math, use the Math frequency: 9.
If you want Science, use 6. If you want Art, use 6. Each category gets its own relative frequency calculation.
The structure is always the same:
Category Frequency ÷ Total Frequency
The only thing that changes is the category frequency.
Step 5: Divide the Category Frequency by the Total
This is the heart of calculating relative frequency. Divide the frequency of the category by the total number of observations.
For Math:
9 ÷ 30 = 0.30
The relative frequency of Math is 0.30. As a decimal, that means Math represents 0.30 of the whole group.
For Science:
6 ÷ 30 = 0.20
The relative frequency of Science is 0.20.
Step 6: Convert the Decimal to a Percentage
Relative frequency can be shown as a decimal, fraction, or percentage. Percentages are often easiest for readers because they are familiar and quick to understand.
To convert a decimal to a percentage, multiply by 100.
0.30 × 100 = 30%
So if 9 out of 30 students chose Math, the relative frequency is 0.30, or 30%.
Here is the same idea in three forms:
- Fraction:
9/30 - Decimal:
0.30 - Percentage:
30%
All three are correct. The best format depends on your assignment, report, or audience.
Step 7: Create a Relative Frequency Table
A relative frequency table organizes your results so they are easy to read. It usually includes at least three columns: category, frequency, and relative frequency.
| Favorite Subject | Frequency | Relative Frequency | Percentage |
|---|---|---|---|
| Math | 9 | 0.30 | 30% |
| Science | 6 | 0.20 | 20% |
| English | 5 | 0.17 | 16.7% |
| History | 4 | 0.13 | 13.3% |
| Art | 6 | 0.20 | 20% |
| Total | 30 | 1.00 | 100% |
Notice that the relative frequencies add up to about 1.00, and the percentages add up to about 100%. Because of rounding, you may sometimes get 99.9% or 100.1%. That does not mean the math gremlins have attacked. It usually just means decimals were rounded.
Step 8: Check Your Work
A good relative frequency calculation should pass a few quick checks:
- Each relative frequency should be between 0 and 1.
- Each percentage should be between 0% and 100%.
- The total of all relative frequencies should be close to 1.
- The total of all percentages should be close to 100%.
- The frequency total should match the number of observations.
If one category has a relative frequency of 1.43, something went wrong. A category cannot represent 143% of the data unless your spreadsheet has started writing fantasy fiction.
Step 9: Interpret the Result in Plain English
Calculation is only half the job. The final step is interpretation. Do not stop at “0.30.” Explain what it means.
Instead of writing:
The relative frequency of Math is 0.30.
Write:
Math was chosen by 30% of the students, meaning 3 out of every 10 students selected it as their favorite subject.
This makes your answer useful, especially for readers who are not statistics experts. A number is good. A number with meaning is better. A number with meaning and no headache is the dream.
Relative Frequency vs. Frequency
Frequency and relative frequency are closely related, but they are not the same.
Frequency is the actual count. If 12 people choose coffee, the frequency is 12.
Relative frequency is the count compared with the total. If 12 out of 60 people choose coffee, the relative frequency is:
12 ÷ 60 = 0.20 = 20%
Frequency answers, “How many?” Relative frequency answers, “What share of the total?” Both are useful, but relative frequency is better when you need to compare groups of different sizes.
Relative Frequency and Probability
Relative frequency is also important in probability. When an experiment is repeated many times, the relative frequency of an outcome can be used to estimate the probability of that outcome.
For example, suppose you flip a coin 100 times and get heads 53 times. The relative frequency of heads is:
53 ÷ 100 = 0.53 = 53%
The theoretical probability of heads is 50%, but your experimental result was 53%. That is normal. Real experiments often wiggle a little. The more trials you run, the closer the relative frequency often gets to the expected probability.
How to Calculate Cumulative Relative Frequency
Cumulative relative frequency is the running total of relative frequencies. It tells you the proportion of observations at or below a certain value.
Suppose students report how many books they read last month:
| Books Read | Frequency | Relative Frequency | Cumulative Relative Frequency |
|---|---|---|---|
| 0 | 3 | 0.15 | 0.15 |
| 1 | 5 | 0.25 | 0.40 |
| 2 | 7 | 0.35 | 0.75 |
| 3 | 4 | 0.20 | 0.95 |
| 4 | 1 | 0.05 | 1.00 |
A cumulative relative frequency of 0.75 at 2 books means 75% of students read 2 books or fewer. This is useful when analyzing test scores, income ranges, response times, age groups, or any ordered data.
How to Calculate Relative Frequency in Excel or Google Sheets
Spreadsheets make relative frequency calculations faster, especially when you have a large data set. The process is the same: count the category, divide by the total, and format as a percentage.
If your category frequency is in cell B2 and the total frequency is in cell B7, the formula is:
=B2/$B$7
The dollar signs lock the total cell, so you can copy the formula down without changing the denominator. Then format the result as a percentage.
If you are counting categories from raw data, you can use COUNTIF. For example:
=COUNTIF(A:A,"Math")/COUNTA(A:A)
This counts how many times “Math” appears in column A and divides it by the total number of non-empty responses.
Common Mistakes When Calculating Relative Frequency
Using the Wrong Total
The most common mistake is dividing by the wrong total. Always divide by the total number of observations, not by the number of categories. If five ice cream flavors appear in a survey of 100 people, you divide by 100, not 5.
Forgetting to Convert to a Percentage
A decimal like 0.42 is correct, but many readers understand 42% faster. If your assignment asks for a percentage, remember to multiply by 100 or use percentage formatting.
Rounding Too Early
If you round every value too early, your final totals may look strange. Keep extra decimal places while calculating, then round at the end.
Confusing Relative Frequency with Cumulative Relative Frequency
Relative frequency measures one category. Cumulative relative frequency adds that category and all previous categories in order. They are related, but they answer different questions.
Real-World Examples of Relative Frequency
Example 1: Survey Results
A café surveys 80 customers about their favorite drink. If 32 customers choose iced coffee, the relative frequency is:
32 ÷ 80 = 0.40 = 40%
This means 40% of surveyed customers prefer iced coffee. The café might use this information to plan promotions, inventory, or menu placement.
Example 2: Website Analytics
A website receives 5,000 visits in a week. If 1,250 visits come from search engines, the relative frequency of search traffic is:
1,250 ÷ 5,000 = 0.25 = 25%
That tells the site owner that search traffic represents one quarter of weekly visits.
Example 3: Classroom Scores
In a class of 25 students, 10 earned an A on a quiz. The relative frequency of A grades is:
10 ÷ 25 = 0.40 = 40%
This helps the teacher understand the distribution of performance instead of only looking at individual scores.
Experience Notes: What Calculating Relative Frequency Feels Like in Real Life
In real experience, relative frequency becomes much easier when you stop treating it as a “statistics formula” and start treating it as a fairness tool. Raw numbers can be loud, but they are not always honest by themselves. A count of 200 sounds impressive until you discover it came from a group of 10,000. A count of 20 sounds small until you discover it came from a group of 25. Relative frequency gives every number a proper seat at the comparison table.
One useful habit is to write the sentence before doing the math. For example: “I want to know what share of the total chose this answer.” That sentence naturally points you toward the formula. The phrase “what share of the total” means you need to divide the part by the whole. This small wording trick helps prevent the classic mistake of dividing by the number of categories instead of the number of observations.
Another practical lesson is that tables save sanity. If you are working with more than two categories, do not try to keep everything floating around in your head like a math circus. Create a simple table with columns for category, frequency, relative frequency, and percentage. The table makes errors easier to spot. If your percentages total 145%, the table will politely wave a red flag. If your total frequency does not match the number of original responses, the table will reveal that too.
Relative frequency is also helpful when explaining results to people who do not love math. Most audiences respond better to percentages than decimals. Saying “0.18 of users clicked the button” sounds like a robot reading a grocery receipt. Saying “18% of users clicked the button” feels clearer and more human. If the audience is younger or completely new to statistics, you can also translate the result into plain language, such as “about 18 out of every 100 users.”
In business and content work, relative frequency can reveal patterns that raw numbers hide. For example, a blog may receive 600 visits from social media and 900 from search. Search has more visits, but if the site had 6,000 total visits one month and 2,000 the next, the relative frequency changes the story. The question is not only “how many visits?” but “what proportion of all visits came from each source?” That is where relative frequency becomes genuinely useful for decision-making.
In classrooms, students often understand relative frequency faster when examples use familiar categories: favorite snacks, shoe sizes, test grades, sports, or phone screen time ranges. The concept becomes less abstract when the data feels real. A table about 30 students choosing pizza toppings may teach the same skill as a textbook table about generic categories, but it is much less likely to make everyone stare sadly out the window.
The best experience-based advice is simple: always label your numbers. Write the total. Write the category. Write the formula. Then write the interpretation. A clean answer might look like this: “There were 18 blue marbles out of 60 total marbles. The relative frequency is 18 ÷ 60 = 0.30, or 30%. Therefore, blue marbles make up 30% of the bag.” That format is clear, complete, and hard to misunderstand.
Relative frequency may look small, but it is one of the most practical ideas in basic statistics. Once you understand it, you start seeing it everywhere: polls, product reviews, sports stats, classroom grades, election summaries, marketing dashboards, and probability experiments. It is not just a formula. It is a way to make comparisons smarter.
Conclusion
Learning how to calculate relative frequency is easier than it first appears. You count how often a category occurs, divide that count by the total number of observations, and then express the result as a decimal, fraction, or percentage. The formula is simple, but the value is powerful.
Relative frequency helps you understand data in context. It makes comparisons fairer, turns raw counts into useful proportions, and supports better decisions in school, business, research, probability, and everyday problem-solving. Once you can build a relative frequency table and explain what each result means, you are no longer just counting things. You are interpreting data like someone who knows where the statistical snacks are hidden.
Note: This article synthesizes standard introductory statistics concepts from reputable educational and statistics-focused references. It is written as original web content for publication, with no unnecessary source-code references or citation placeholders included.